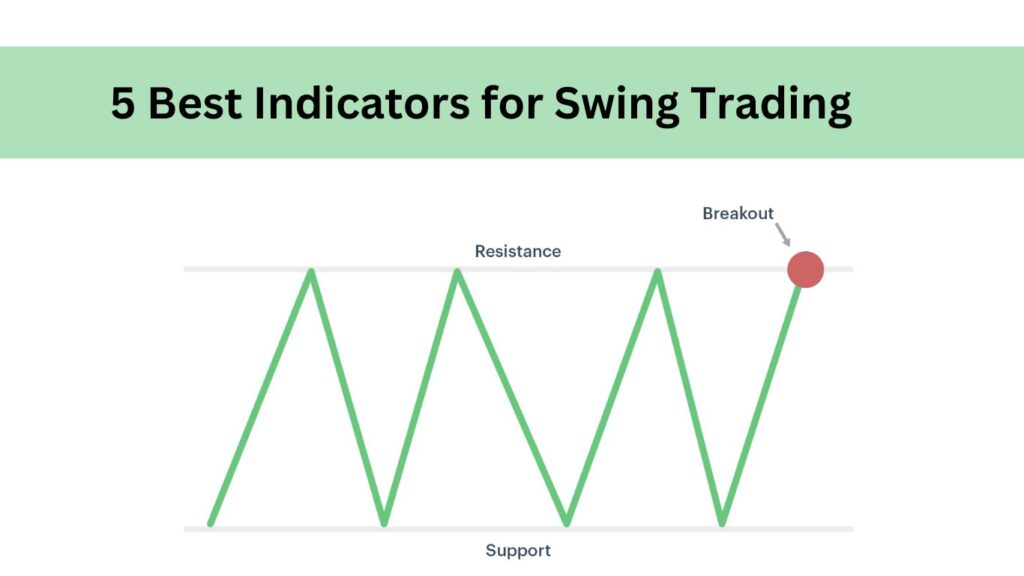
5 Best Indicators for Swing Trading

Swing trading is a strategy where traders seek to capture short- to medium-term price movements over a period ranging from a few days to a few weeks. Unlike day trading, where positions are opened and closed within the same day, swing traders aim to profit from price swings or ‘waves’ in the market by identifying the highs and lows during a specific time frame. In this article, we’ll discuss the 5 best indicators for swing trading that can help you identify trends, reversals, and profitable entry

WhatsApp Group Join Now
Telegram Group Join Now

Swing trading is particularly popular because it requires less time than day trading while still allowing traders to benefit from price fluctuations. Traders use technical analysis, including indicators, to determine entry and exit points.

List of the Best Indicators for Swing Trading

Some of the most effective indicators for swing trading include:

  • Moving Average Convergence Divergence (MACD)
  • Relative Strength Index (RSI)
  • Bollinger Bands
  • Fibonacci Retracement
  • Stochastic Oscillator

Each of these indicators provides unique insights into market conditions and helps traders make informed decisions about entering or exiting trades.

5 Best Indicators for Swing Trading

1. Moving Average Convergence Divergence (MACD)

The Moving Average Convergence Divergence (MACD) is a momentum-based, trend-following indicator that highlights the interaction between two moving averages of an asset’s price. It is determined by subtracting the 26-period Exponential Moving Average (EMA) from the 12-period EMA. Additionally, the MACD incorporates a signal line, which is the 9-period EMA of the MACD, to help identify potential buy or sell signals.

Why is MACD useful for swing trading?

MACD helps swing traders by identifying potential buy and sell signals when the MACD line crosses the signal line. It also provides insights into the strength of the trend and potential reversals.

Bullish Signal: MACD crosses above the signal line.

Bearish Signal: MACD crosses below the signal line.

MACD is especially valuable in detecting momentum shifts and gauging whether a trend is gaining or losing steam.

Read Also: A Comprehensive Guide to Investing in the Stock Market

2. Relative Strength Index (RSI)

What is RSI?

The Relative Strength Index (RSI) is a momentum oscillator that measures the speed and change of price movements on a scale of 0 to 100. RSI is used to identify overbought and oversold conditions in a market.

Why is RSI useful for swing trading?

RSI helps swing traders spot potential reversal points by signaling whether an asset is overbought or oversold.

Overbought: RSI above 70 indicates that the asset might be overvalued and a price correction could be imminent.

Oversold: RSI below 30 signals that the asset might be undervalued, and a price bounce could follow.

Swing traders use RSI to fine-tune their entry and exit points, especially when the RSI crosses key levels of 30 and 70.

3. Bollinger Bands

What are Bollinger Bands?

Bollinger Bands consist of three lines: a middle simple moving average (SMA) and two outer bands representing two standard deviations away from the SMA. These bands expand and contract based on market volatility.

Why are Bollinger Bands useful for swing trading?

Bollinger Bands are excellent for measuring market volatility. They help swing traders spot potential breakouts and reversals by showing when prices are at extreme levels relative to historical volatility.

Buy signal: When the price touches or crosses the lower Bollinger Band.

Sell signal: When the price touches or crosses the upper Bollinger Band.

Bollinger Bands are useful in highly volatile markets where prices tend to revert to the mean after extreme movements.

4. Fibonacci Retracement

What is Fibonacci Retracement?

Fibonacci Retracement is a tool based on key levels derived from the Fibonacci sequence (23.6%, 38.2%, 50%, 61.8%, and 100%). Traders use these levels to identify potential support and resistance zones where price reversals may occur.

Why is Fibonacci Retracement useful for swing trading?

Fibonacci levels help swing traders predict where price pullbacks may end and trend continuation may begin. It’s particularly effective in spotting areas where trends could pause or reverse.

Key levels: 38.2% and 61.8% are often the most reliable retracement levels for spotting potential reversals.

Fibonacci Retracement is widely used to determine entry points in pullback trading or to confirm exit levels during trend-following strategies.

5. Stochastic Oscillator

What is the Stochastic Oscillator?

The Stochastic Oscillator is a momentum indicator that compares a security’s closing price to its price range over a specified period. It ranges from 0 to 100 and consists of two lines: %K and %D.

Why is the Stochastic Oscillator useful for swing trading?

The Stochastic Oscillator helps swing traders by identifying overbought and oversold conditions, similar to RSI, but it is more sensitive to price changes.

Buy signal: %K crosses above %D in the oversold region (below 20).

Sell signal: %K crosses below %D in the overbought region (above 80).

This indicator is often used by swing traders to detect short-term market reversals and optimize entry and exit points.

Information provided by this Best Indicators for Swing Trading

Swing trading indicators offer vital insights such as:

Trend direction: Identifying whether the market is trending upwards or downwards.

Momentum: Showing the speed and strength of a market move.

Volatility: Revealing market fluctuations and potential breakout or breakdown points.

Overbought/oversold levels: Indicating potential reversal points when an asset becomes too overbought or oversold.

Support and resistance levels: Highlighting price points where a stock could experience buying or selling pressure.

These insights allow traders to fine-tune their strategies and minimize risks.

Best Patterns for Swing Trading

Swing traders often look for the following chart patterns to complement their indicator-based strategy:

Head and Shoulders: Signals a potential reversal.

Double Top/Double Bottom: Indicates possible reversals after two failed attempts to breach a support or resistance level.

Triangles (Ascending, Descending, Symmetrical): Highlight consolidation and potential breakouts.

Flags and Pennants: Suggest strong continuation of trends after brief consolidation.

These patterns help traders visualize potential market moves.

Suggestions for Swing Trading Indicators

When using indicators for swing trading, it’s crucial to:

Avoid overcomplicating: Use 2-3 indicators that complement each other rather than cluttering your chart with too many.

Adjust time frames: Swing traders should focus on daily or 4-hour charts to get the most relevant signals.

Backtest your strategy: Test your indicators on historical data to ensure they perform well in different market conditions.

A combination of momentum and trend indicators often works best for swing traders.

The combination of Best Indicators for Swing Trading to make well-informed decisions and maximize profits. Each of these indicators—MACD, RSI, Bollinger Bands, Fibonacci Retracement, and Stochastic Oscillator—provides unique insights into market behavior, helping traders identify trends, measure momentum, and spot potential reversals. By combining multiple indicators, swing traders can create a robust trading strategy that adapts to changing market conditions.

However, it’s essential to avoid overloading your charts with too many indicators. The key to successful swing trading lies in mastering a few well-chosen indicators and using them in conjunction with solid risk management techniques.

Frequently Asked Questions

1. What are the best indicators for swing trading?

The best indicators for swing trading include MACD, RSI, Bollinger Bands, Fibonacci Retracement, and Stochastic Oscillator.

2. How many indicators should I use for swing trading?

Most traders use a combination of 2-3 indicators to avoid conflicting signals and to keep their trading approach streamlined.

3. Can I use swing trading indicators for day trading?

Yes, swing trading indicators can also be used for day trading, but the settings and time frames will need to be adjusted for shorter periods.

4. What time frames are best for swing trading?

The most common time frames for swing trading are daily (D1) and 4-hour (H4) charts, as they offer a balance between short-term fluctuations and long-term trends.

5. What tools are needed for swing trading?

To swing trade effectively, traders need a reliable trading platform with charting tools, indicators, and access to market data. Popular platforms include MetaTrader, TradingView, and Thinkorswim.

WhatsApp Group Join Now
Telegram Group Join Now

Leave a Comment